Level Supply Dashboard
Overview
The Level Supply Dashboard is designed to provide clear visibility into how liquid resources are used and consumed within a container or storage system.
Unlike the Level Discharge Dashboard, which focuses on removal or emptying processes, the Level Supply Dashboard is built for scenarios where understanding how much liquid is being used over time is critical for operational planning, budgeting, and efficiency monitoring.
By combining real-time data with historical insights and cost tracking, the Level Supply Dashboard provides a complete picture of liquid supply usage — helping you manage resources efficiently, control costs, and maintain uninterrupted operations.
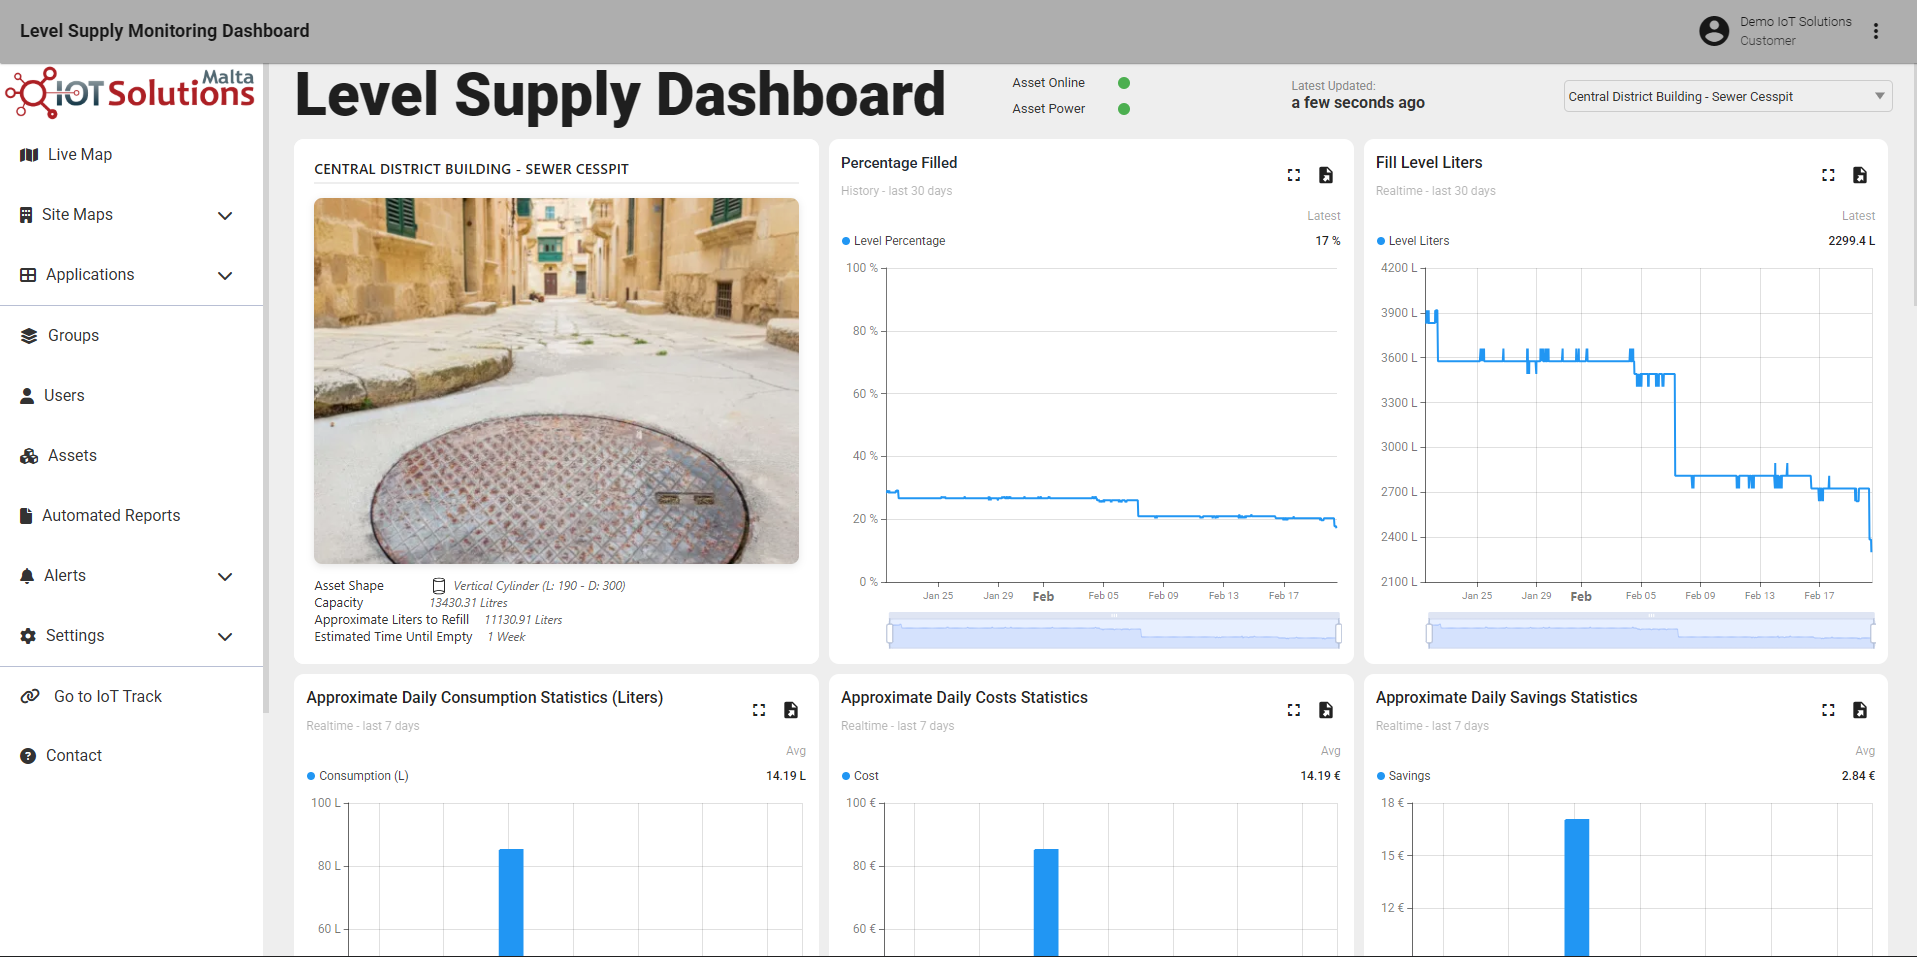
IoT Pro Platform - Level Supply Dashboard
What This Dashboard Shows
The Level Supply Dashboard consolidates key metrics and visual insights to help you understand supply usage and performance, including:
Current fill level displayed in both percentage and liters, giving you an immediate picture of how much supply remains in the container at any given moment.
Estimated time until empty and refill requirements, so you can plan ahead and avoid unexpected supply shortages.
Daily consumption trends to help you track usage patterns over time and identify periods of unusually high or low consumption.
Flow rate insights to monitor liquid movement and confirm that usage behavior aligns with what is expected for your operation.
Cost tracking based on the volume of liquid consumed, helping you understand the financial impact of day-to-day usage.
Savings and profit insights where applicable, such as in scenarios involving cost recovery, resale, or efficiency improvements.
Historical trends to support longer-term forecasting, budget planning, and resource management decisions.
Alert notifications for critical level thresholds or abnormal activity, ensuring you are informed before supply runs critically low or an issue develops.
How It Helps You
The Level Supply Dashboard enables you to:
Monitor how quickly liquid resources are being consumed, and verify that usage aligns with expected operational demands.
Forecast refill needs in advance, helping you prevent supply shortages that could disrupt operations or cause downtime.
Track operational costs over time and gain a clearer understanding of usage-related expenses to support better budgeting.
Identify inefficiencies, leaks, or unusual consumption patterns early, before they result in significant waste or financial loss.
Measure savings and profitability in scenarios where cost recovery or resale of liquid resources is part of your operation.
Improve planning and resource management decisions by having accurate, up-to-date consumption data readily available.
Typical Use Cases
This dashboard is particularly well suited to:
Diesel fuel storage and generator supply monitoring, where knowing remaining fuel levels and consumption rates is critical to avoiding downtime.
Water storage and distribution systems that require continuous oversight of available supply and usage trends.
Industrial fluid usage monitoring to track consumption of process fluids, lubricants, or chemicals across operational cycles.
Agricultural irrigation supply tanks where water availability and usage efficiency directly impact productivity.
Chemical and process fluid storage systems where accurate level monitoring is essential for both operational and safety reasons.